There are numerous question that bother bettors when they are about to place a bet. Some of the many and perhaps, the most important ones, are how to determine the number of goals that are expected per match and how often one shot become a goal. Maybe one of the most important questions for bettors is to find out how they can use past data to predict the expected goals per a match. Thus, what bettors need in order to tackle these issues and to place a valuable bet is information and a model. Continue reading to find out how to use a model for expected goals to predict the score in a soccer match.
It is a well known fact that goals in soccer are pretty rare occurrences. The average number of goals per game over the last five seasons in the Premier League is only 2.73 goals. The book The Numbers Game holds the belief that up to 50 % of any match result can be down to luck, the bounce of the ball or the decision of the referee.
Therefore, in order to make more precise predictions, one should always take into account a bigger sample of data. Therefore, it is better to use the 8.49 shots on target, or maybe the 25.7 total shots, instead of the average 2.73 goals per game in the 2015/16 Premier League season.
The likelihood a shot to become a goal depends on various factors and varies to a great degree. Therefore, we use the expected goals (xG) models to calculate the probability. For example, in England’s top division, in 9.7 % of the shots, a goal is scored. This number is valid for the last five seasons. However, if we break down those shots into different categories, only then will we see the variation of the conversion rate.
When historical data kick in, we are able to calculate how likely it is for a single shot to be converted into a goal. We do this by calculating as many or as few factors in. whatever we like. For example, some of the most thorough models make difference whether the goal was scored with foot or head, what the situation was when the goal was scored, etc. This involves indeed very complex data gathering and analysis skills. However, much simpler expected goals system exists which allow the bettors to gather valuable insights into the matter.
What is the value of different types of shots?
According to Opta, there are high-quality opportunities which are called ‘high chances’. These are situations where a shot is expected to be converted into a goal (usually when there is one-on-one occasion or from very close range).
The expected goal value to penalties is set to be 0.783. This number is derived from the data where out of the 443 penalty shots in the Premier League between 2011/12 and 2015/16, 347 were goals.
In a period of past five seasons in the English top flight, there were a total of 6.213 big chances, in which 2.579 were scored. Penalties were also included in these numbers. Therefore, if we deduct the penalties, non-penalty big chances have been converted at a reate of 38.7 %, or expressed as an xG value – 0.387.
The last five years saw 22.822 non-big chances in the box with 1.587 scored, which gives an xG of 0.070.
Between August 2011 and May 2016 in the Premier League, there were 22.318 shots from outside the box. 809 of them were scored, giving an average of 3.6 % chance of shots to be converted into a goal. Thus, the xG for shots from outside the box is set to 0.036. Free-kick shots are converted at a rate of about 5-6 %, and this provides for a slight variation within this, but for simple systems, 3.6 % is enough.
How to determinate expected goals per team
If we look at the matches of this season, until 12th March 2017, out of 211 matches from the Premier League which were won (excluding own goals), the team that hat the most shots won in 151 of them (71.6 %) and the team with the highest xG score, won in 170 matches (80.6 % of the time).
If we use the Poisson method and the xG data from the 2016/17 season, we can make the predictions as follows in the table below. This figures are for the matches in Premier League week 29.
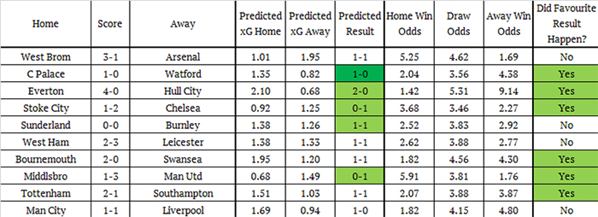
According to the table, one correct score did turn out to be correct, as well as four other result choices (home win, draw or away win). If we use the odds given by the system’s calculations, it is clear that the favourite won the bet in six out of ten matches.
What are the imperfections of the xG predictive model?
The factors that influence the final outcome of a soccer match, like injuries, change of manager or fatigue of the team, are the same factors that play a great deal in whichever system a bettor uses for calculating the odds. Therefore, bettors should always be aware of the limitations of any model.
These systems are all based on averages and as about half of the matches see less than 2.5 goals, it may be expected that a system of this kind will not be able to predict an especially high scoring game.
However as already noted that all shots on average are worth 0.097 goals, a simple system of this kind indicate that the shots made by Manchester City are worth 0.113 and those by Hull are only worth 0.083.
Everything taken into account, bettors should always use statistical data for expected goals in connection with the Poisson distribution. In that way, one will be able to accurately quantify the team’s defence and attack.